Volume Validations
Volume Validations in Rudol allow data teams to monitor table row counts over time, detect unexpected fluctuations using AI-driven anomaly detection, and receive automated alerts when incidents occur.
Creating a Volume Validation
A Volume Validation monitors the number of rows in one or more tables at a defined frequency. Rudol uses AI-based anomaly detection to learn historical behavior, establish expected ranges, and identify outliers.
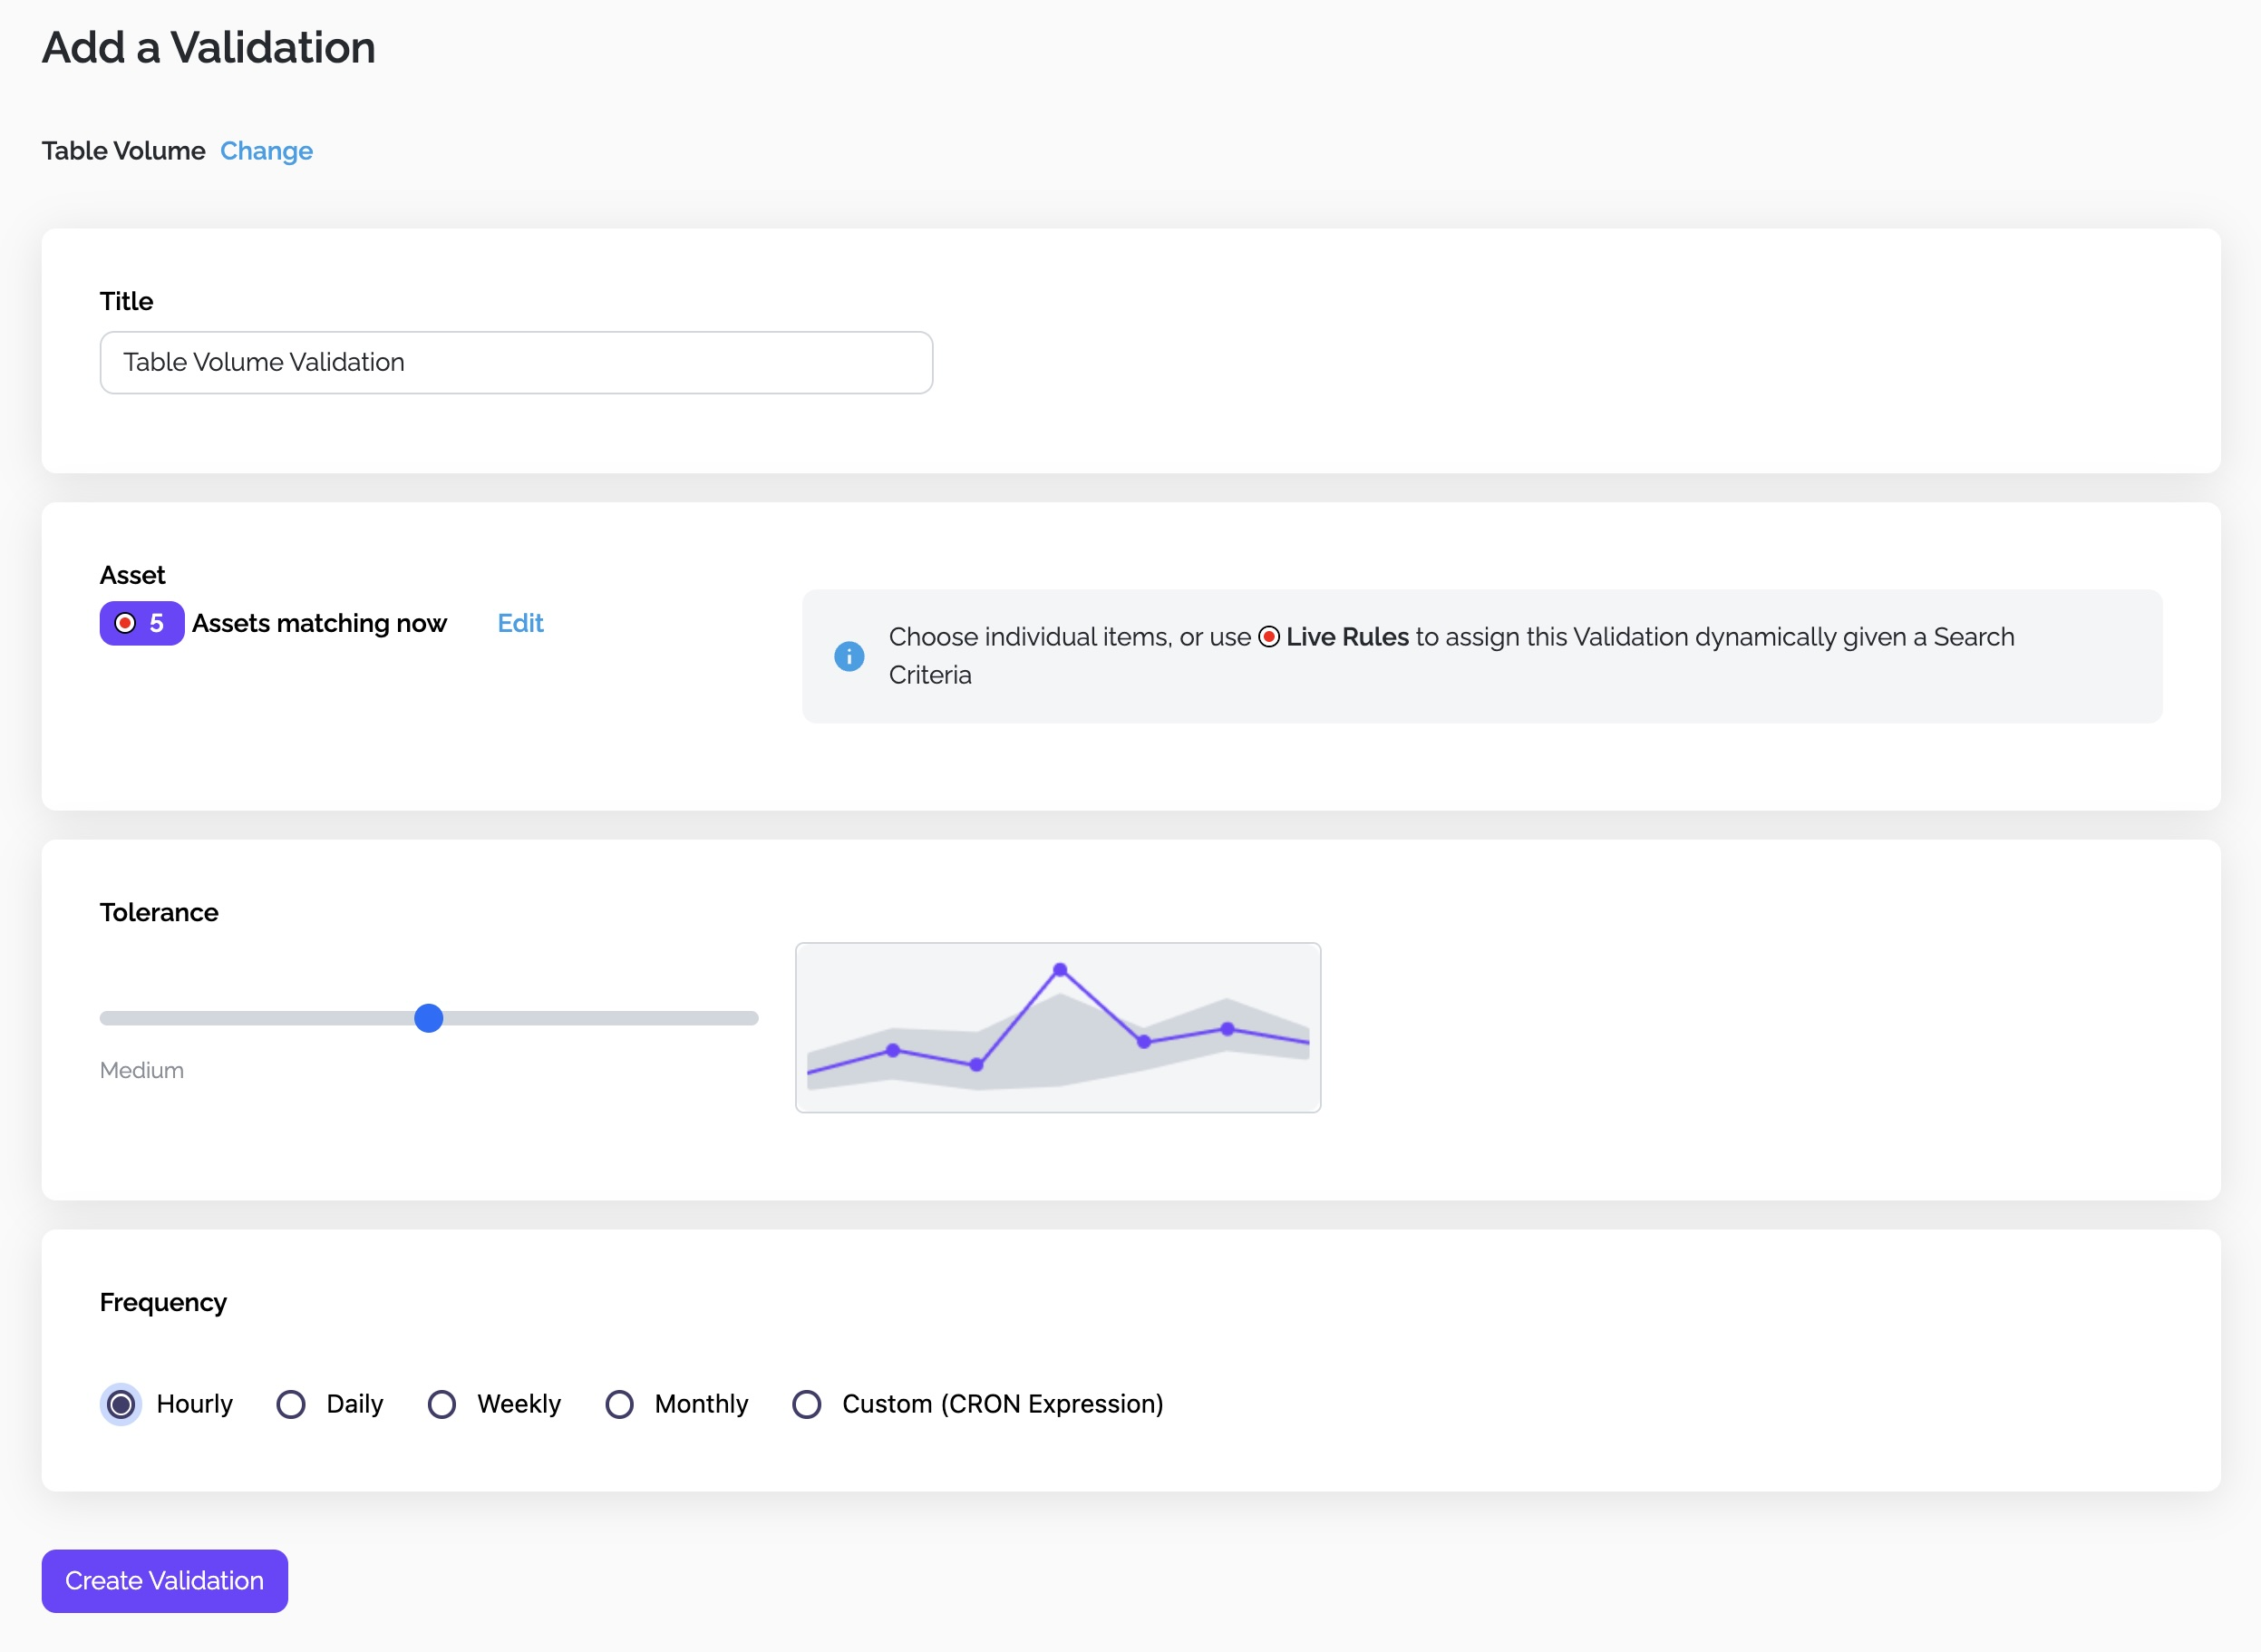
Assign a clear and concise name that reflects the purpose of the validation—for example:
- “Orders – Daily Row Count Stability”
- “Payments Tables – Hourly Volume Monitoring”
Names should make incidents immediately interpretable by data engineers and business users.
Selecting Assets
You can target three types of asset groups:
Single Table
Choose a specific table when the validation applies to a single, known dataset.
Multiple Tables
Select several tables manually when they share similar behavior or business logic.
Live Rules (Dynamic Selection)
Live Rules identify tables dynamically at execution time according to search criteria. Valid attributes include:
- Table name
- Domain
- Technology
- Tags
- Owner
If new tables match the rule, they are added automatically. If tables stop matching, they are removed. Validation runs apply universally to the current matching set.
Tolerance Level
Tolerance determines the sensitivity of Rudol’s anomaly detection:
| Tolerance | Behavior | Trade-off |
|---|---|---|
| Low | Very sensitive | More false positives |
| Medium | Balanced detection | Default choice |
| High | Less sensitive | Fewer alerts but anomalies may go unnoticed |
Tolerance directly affects the width of the AI-generated expected range.
Execution Frequency
Volume Validations can run:
- Hourly
- Daily
- Weekly
- Monthly
- Using a custom CRON expression
The chosen frequency impacts how fast the model collects training samples. All assigned assets, including those selected through Live Rules, use the same frequency.
Training Mode
Once created, the validation enters Training Mode. Rudol collects historical samples to learn normal behavior.
- Requires ~500 samples over at least 3 weeks.
- The threshold is not fixed; it depends on execution frequency and data stability.
- You must choose frequency carefully to avoid excessively long training periods.
- When enough samples are gathered, the validation transitions automatically to Prediction Mode.
Interpreting Validation Results
Once in Prediction Mode, Rudol begins identifying anomalies and raising incidents.
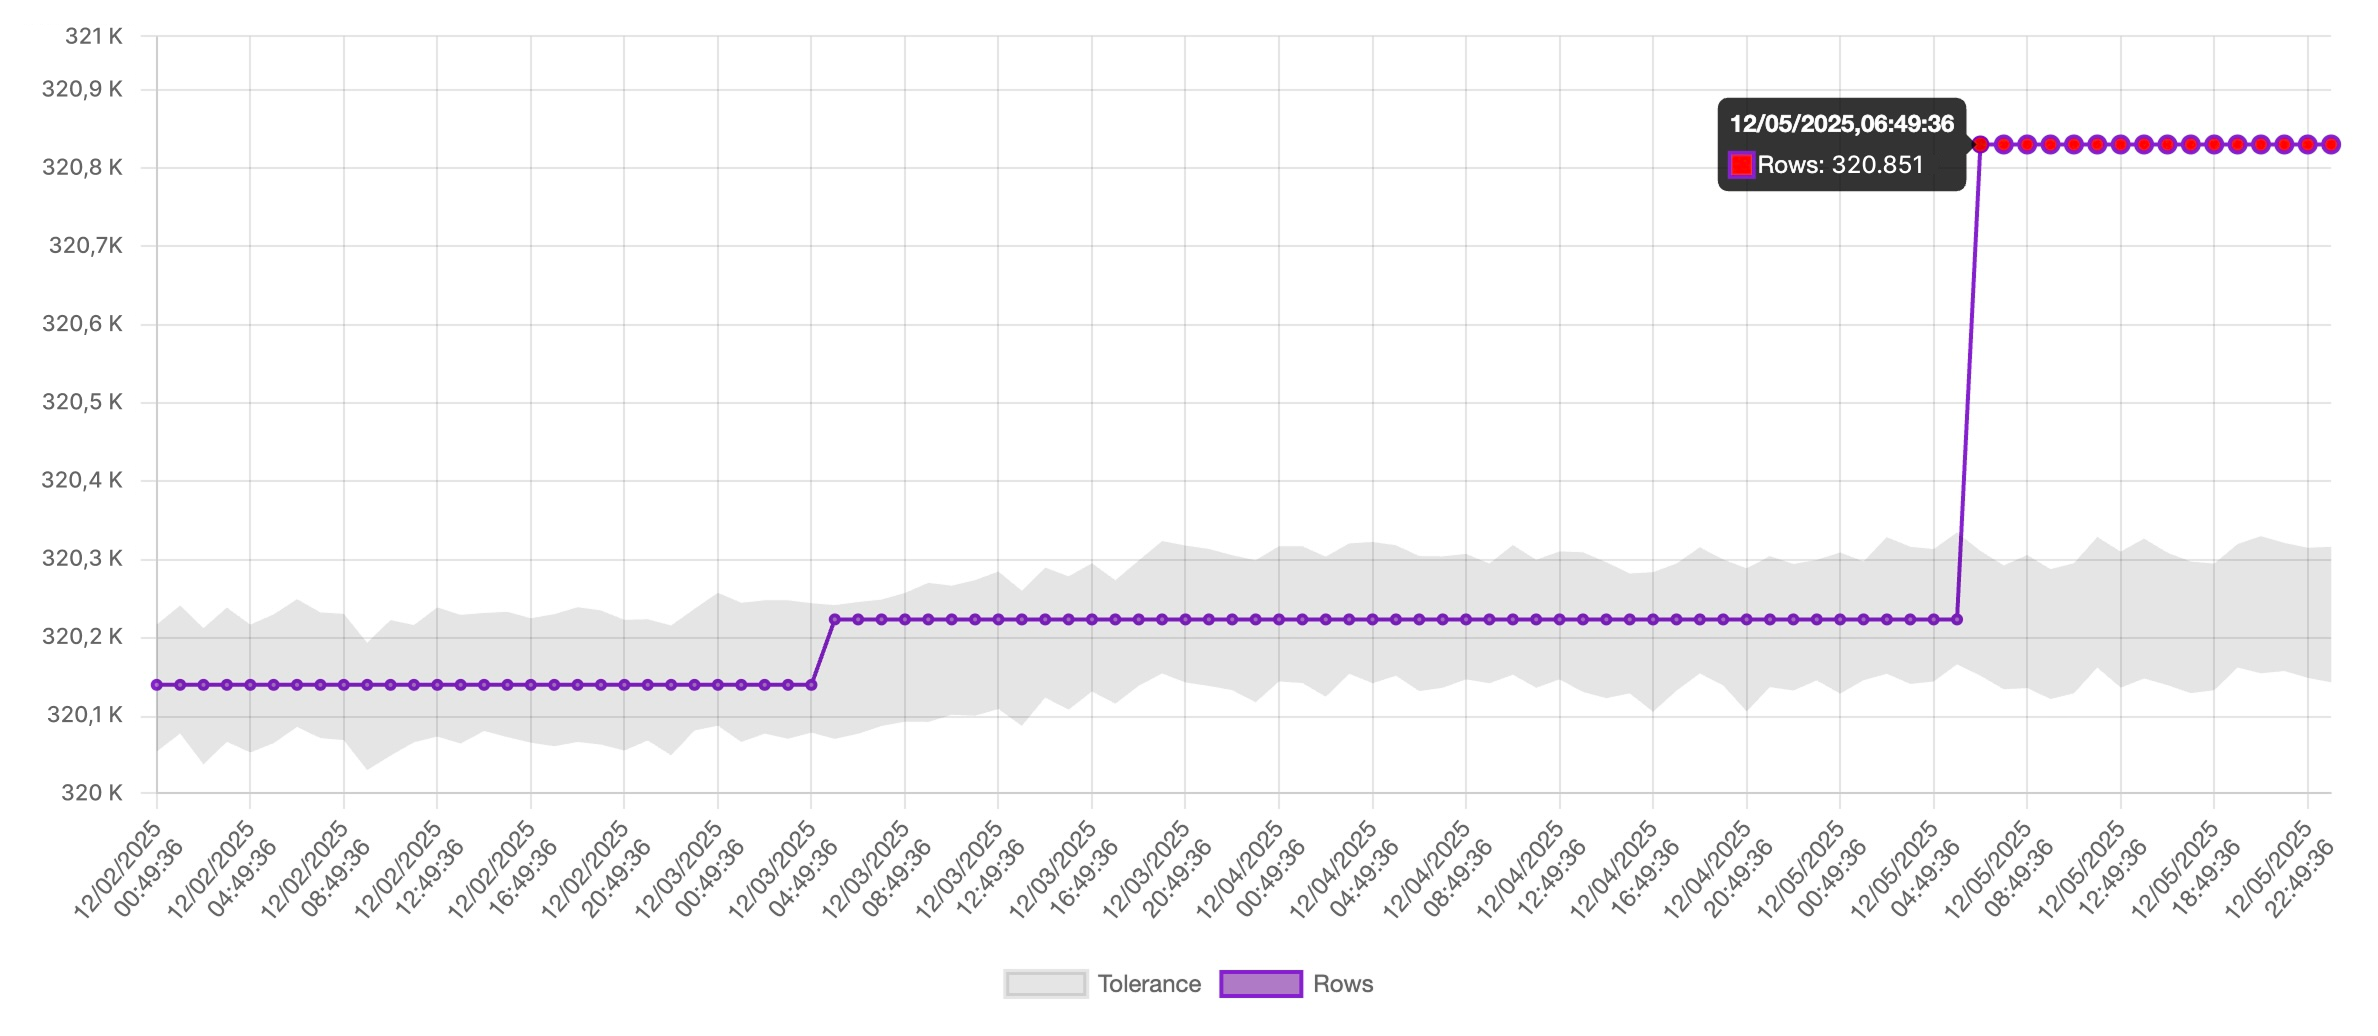
Each validation displays a time-series chart:
- Purple line: actual row count observed at each execution.
- Grey band: AI-generated expected interval based on historical patterns and tolerance settings.
- Red dots: points outside the expected interval, representing anomalies.
The chart updates continuously as new samples arrive.
Understanding Anomalies
A red point indicates that Rudol has detected a deviation significant enough to trigger a Data Quality Incident. The anomaly itself is not categorized by severity; incident management and alert routing determine follow-up actions.
Alerts and Notifications
When an anomaly is detected alerts are sent automatically to:
- All users subscribed to the validation (email + in-app notifications)
- Configured integration channels: Slack, Microsoft Teams, Google Chat
This ensures immediate visibility across operational and analytics teams.
Handling Spikes
If a sudden change is known to be valid, like a backfill or a batch reprocessing, you can mark the anomaly as “Not an incident” from the Incident view.
This action:
- Feeds corrective feedback to the AI model
- Helps the system adjust expectations faster
- Avoids repeated false positives in the future
There is no need to manually reset the training process: Rudol retrains continuously as it accumulates more data.